Hardware
The vAnalyzer is PC based measurement system. There are various systems available, ranging from a small external USB-box connected to a notebook with 2, 4, 8,12 or 16 channels up to a large systems with 64 channels using LAN connection.
Special versions of the vAnalyzer allow the data transfer from different external systems. For solutions in order to interface customer systems please contact us.
Generally the import of measurement data can be conducted using the UFF file format or user-defined ASCII files.
Highlights:
- 2 to 64+ Channels
- ICP, AC/DC
- 1 to 8+ Signal Generators
- Tacho Input
- Frequency Range 0 to 80 kHz
- Input
- –24bit
- -±100mV – ±10V in steps 1,2,5
- Sensor-Database
- FFT-Analyzer
- Auto Spectra
- Cross Spectra
- FRF (H1,2,3)
- Coherence
- etc
- Recorder Function
- On Hard Disc
- RMS Time Series
- Triggered Measurement
- Windows XP/7
Analysis and Graphic Environment
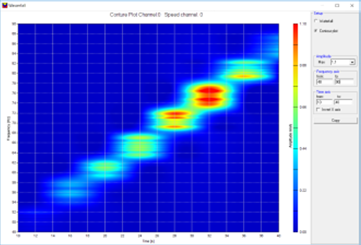
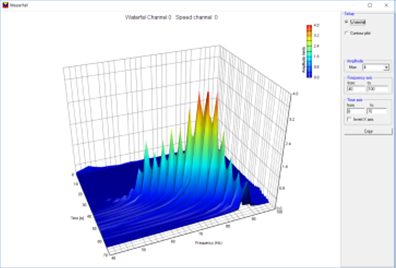
The flexible display makes it easy to show a lot of different diagrams and spectra. The user may display diagrams of various types:
- Time weighted/unweighted
- Time KB weighted
- RMS and Max/Min weighted
- FFT-spectra
- Auto-spectra
- Cross-spectra
- FRF 1, FRF 2 and FRF 3
- Coherence
The display settings can be saved to files and recalled easily. Doing so up to 8 different display settings can be toggled by hot keys in order to quickly switch between the interesting views. This feature will prove to be extremely useful, while working with a multi-channel system.


Time Data Recorder
One of the key features of the vAnalyzer is the time data recorder functionality. Taking advantage of nowadays fast high capacity hard disc drives, the user will be able to record multi-channel signals over longer durations. Using the record watch mode the analyzer will record the time series for the specified period of time after the signal has met the trigger conditions.
All data files recorded may later be analysed, using the vAnalyzer the same way as at an online measurement.
Settings
All settings for the frequency range, the frequency resolution, the amplifier, the ICP source, as well as trigger- and windowing functions can be entered to clearly laid out graphic input masks. The settings may be saved on hard disc and recalled at any time. The vAnalyzer is provided with an integrated sensor database that enables it to read the entered calibration factors of the sensors directly.
Generator Output
The onboard generator allows to generate signals
- sine
- Noise
- Chirp
- step sine.
Where necessary the generator signals are automatically synchronised to the measured time blocks by internal triggering, e.g. when driving a shaker with a chirp signal.
Measurement Database
The user may save all time and spectral data in the vAnalyzer data format, to be played back for further editing.

Modal Interface
The vAnalyzer includes the integrated interface to the Modal Analysis package vModal. Furthermore the data can be saved to disk as UFF-or as ASCII-files.
Reporting
All Graphs can be exported as wmf-files, copied to clipboard or directly send to the printer.
